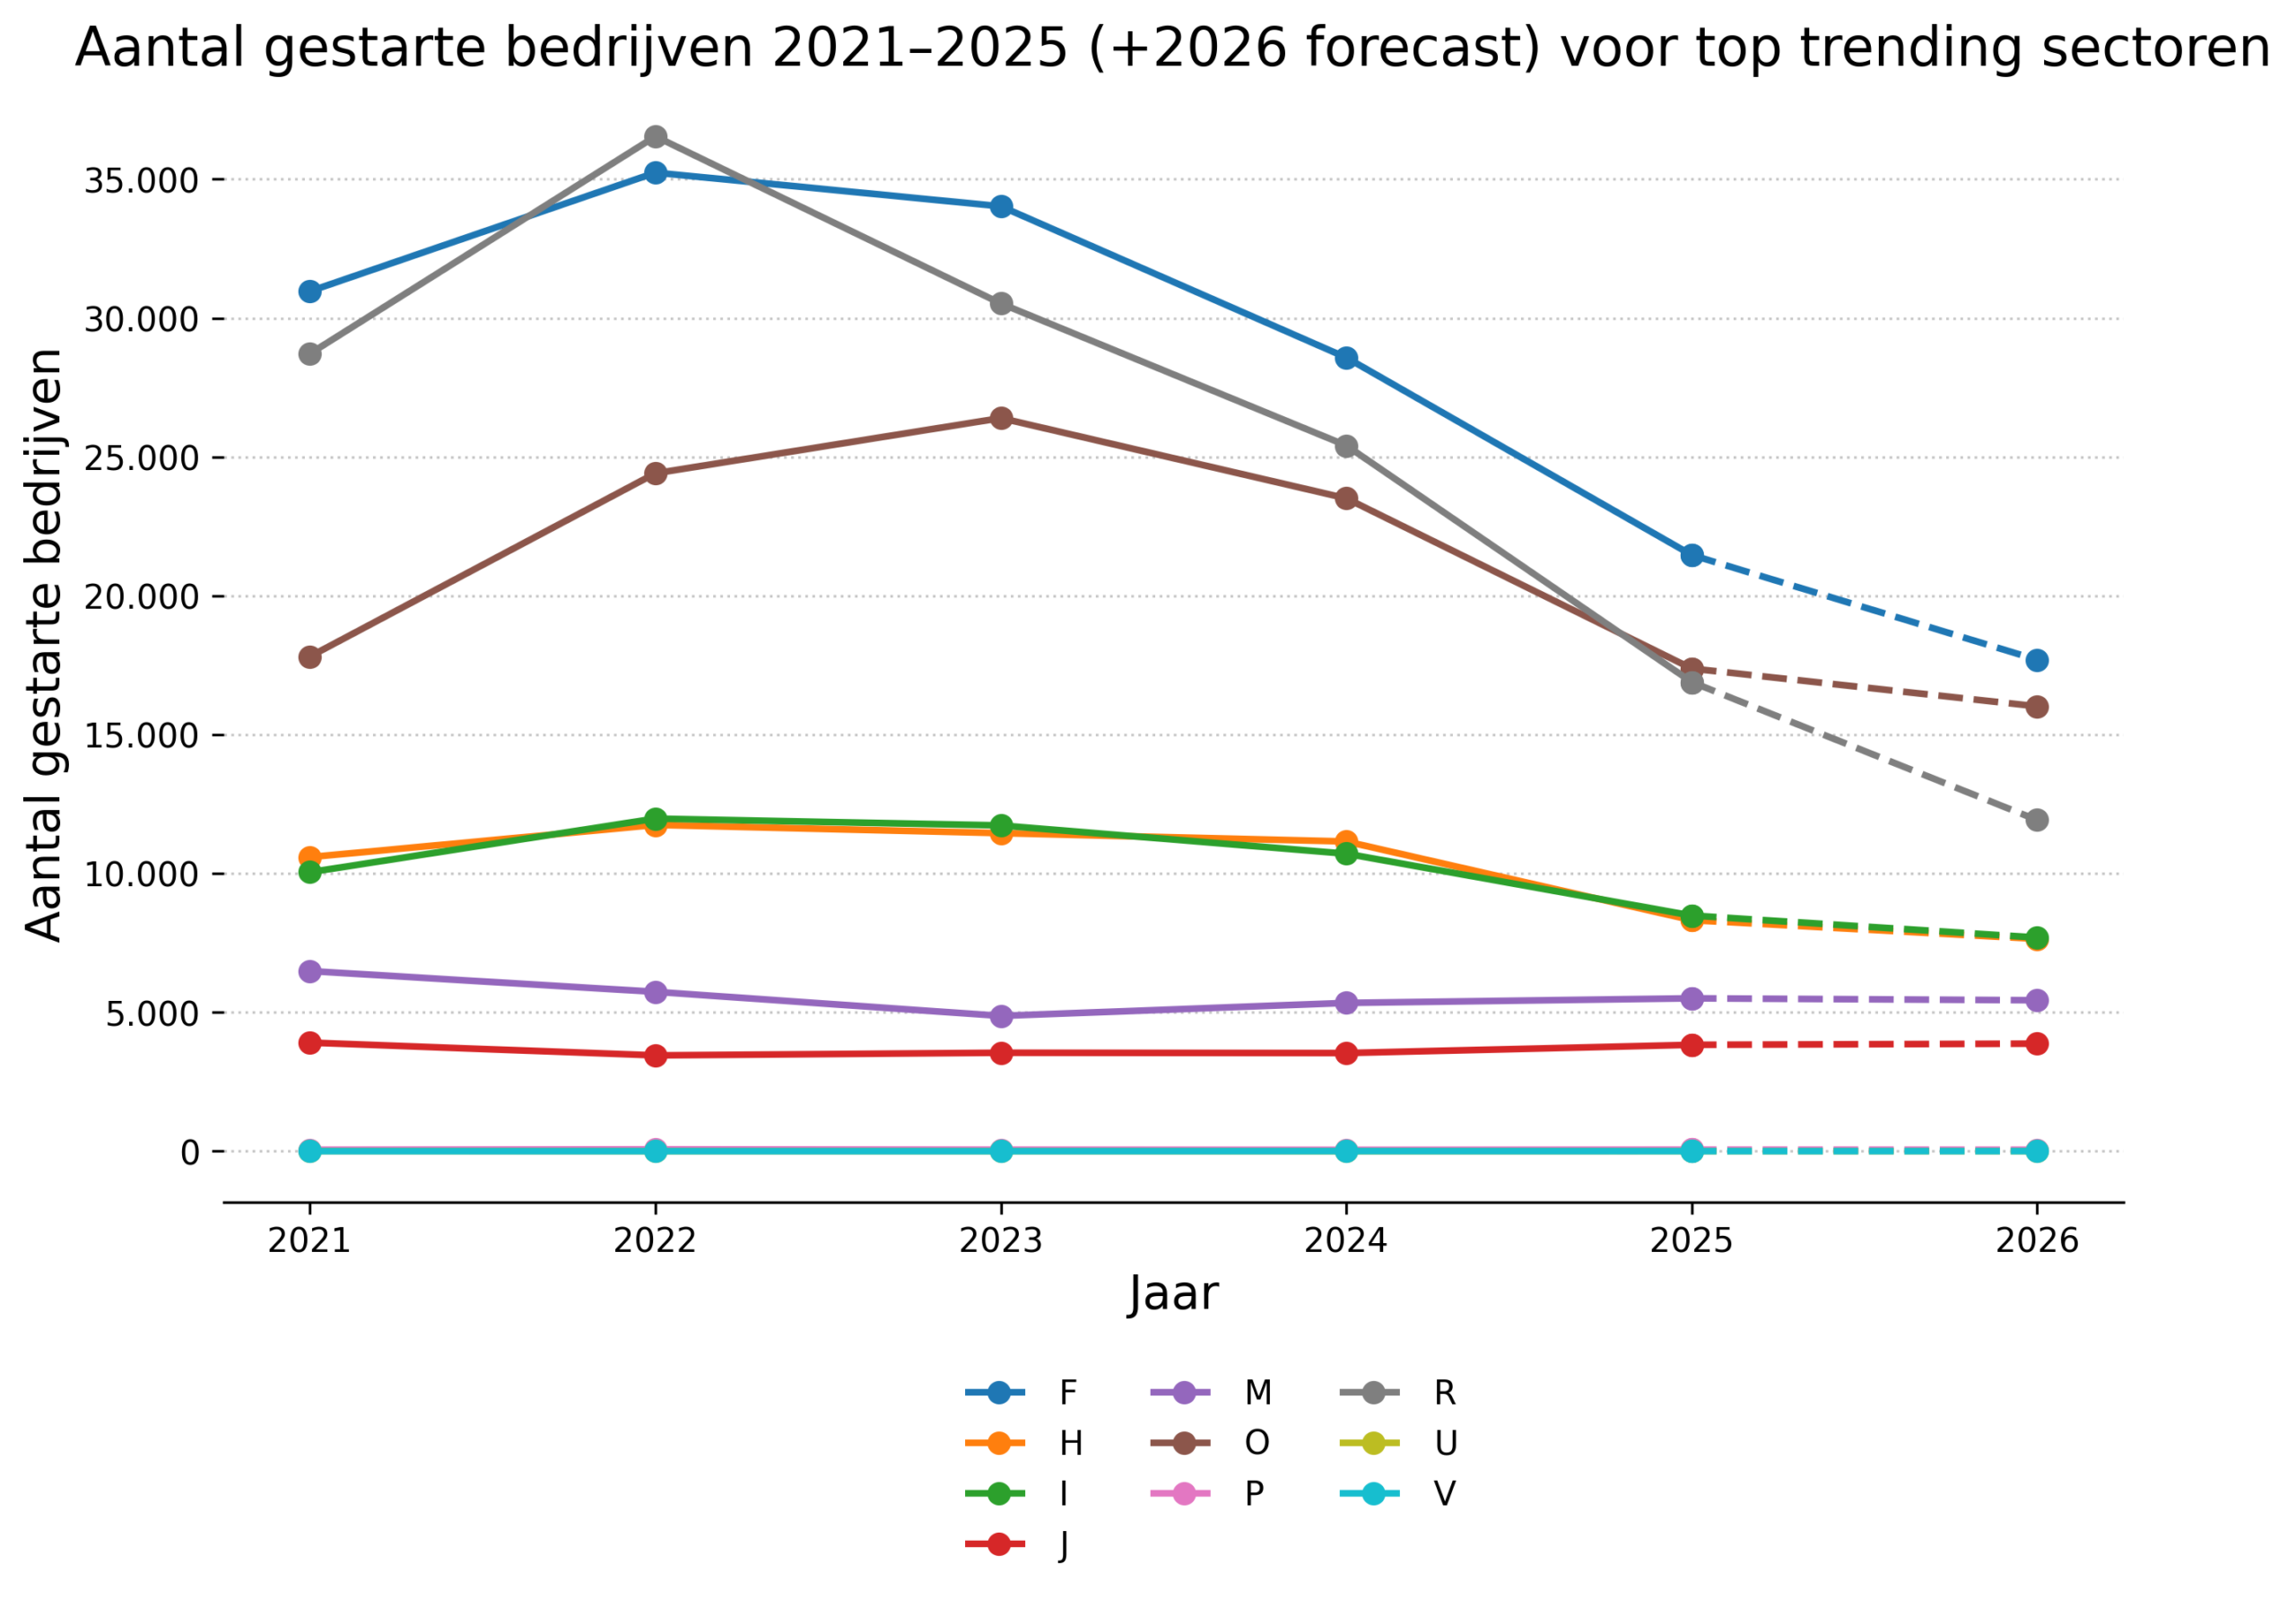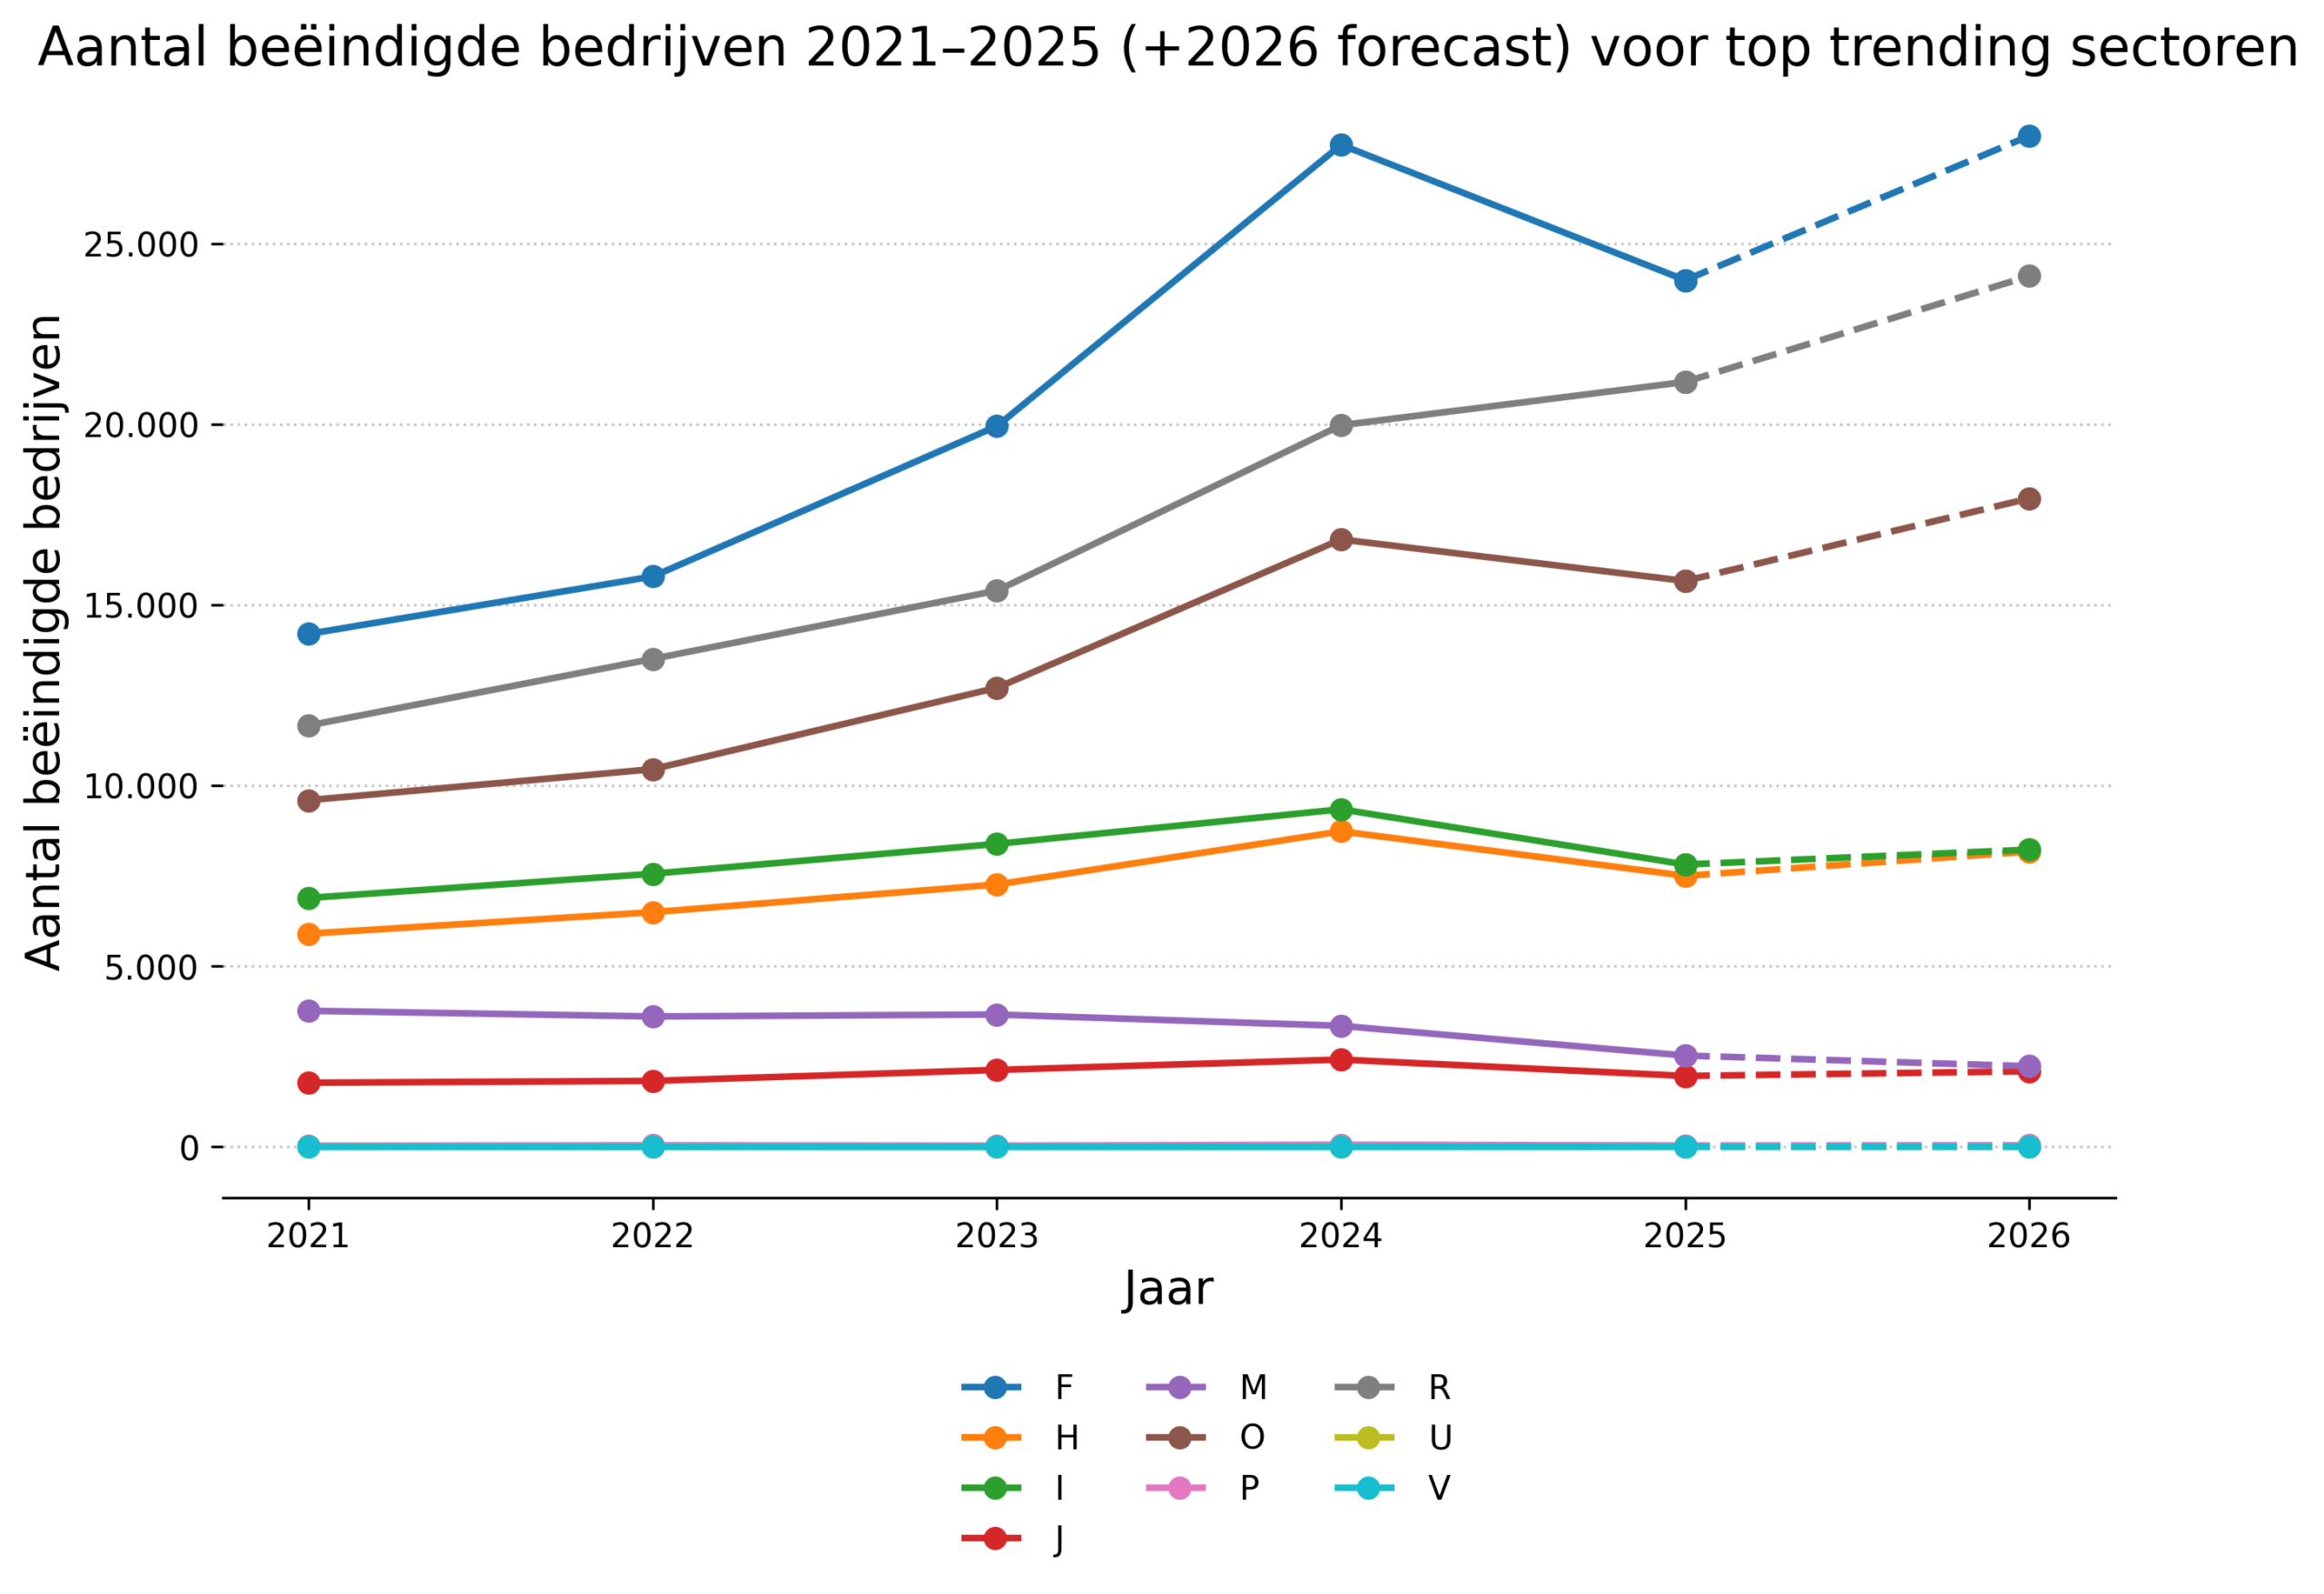
The 2024 and 2025 figures show that the entrepreneurship landscape is not moving uniformly, but is increasingly driven by sectoral differences. While some sectors consolidate or accelerate their growth, others turn from growth to contraction in a short period of time. The combined analysis of trend graphs and weighted net growth over the 2021-2025 period shows that these developments are less explained by occasional spikes but point to a structural realignment of entrepreneurship.
The following is an analysis of key growth drivers, sectors under pressure and long-term trends.
The engines of growth: Technology and trade
The strongest growth driver remains the scientific and technical activities sector (sector N). With over 56,000 start-ups and a net growth of nearly 25,000 enterprises, this is by far the most dominant sector. At the same time, this sector also has the highest number of terminations, indicating a dynamic and competitive playing field. Entry is easy, but continuity is not a given, so growth and failure go hand in hand.
Table 4: Most started businesses (2025).
| SBI | Sector | Started | Terminated | Net growth |
| N | Scientific and technical activities | 56.092 | 31.401 | +24.691 |
| G | Wholesale and retail trade; automotive repair | 31.969 | 28.084 | +3.885 |
| L | Financial services (excluding insurance and pension funds) | 22.422 | 14.359 | +8.063 |
| F | Construction | 21.468 | 23.989 | -2.521 |
| T | Other services | 20.349 | 11.191 | +9.158 |
In addition to the technical sector, the wholesale and retail trade (sector G) is also showing a clear acceleration. Net growth here is rising sharply year-on-year, from +1,441 in 2024 to +3,885 in 2025. This indicates renewed entrepreneurial confidence, possibly fueled by stabilizing consumer spending and the further adaptation of business models to online and omnichannel sales.
Table 5: Top 5 sectors with the highest net growth (2024 vs. 2025)
| SBI | Sector | Net growth 2024 | Net growth 2025 | Change |
| G | Wholesale and retail trade; automotive repair | 1.441 | 3.885 | +2.444 |
| Q | Education | 3.215 | 4.437 | +1.222 |
| K | IT, telecommunications and consulting | 2.905 | 3.945 | +1.040 |
| M | Operation of real estate trading | 1.991 | 2.977 | +986 |
| T | Other services | 8.367 | 9.158 | +791 |
Shift to knowledge-driven services
A striking development is visible in financial services (sector L) and other services (sector T). These sectors are among the largest inflow categories and combine this with a relatively low termination rate, resulting in strong positive net growth. This trend points to a sustained demand for specialized and often knowledge-driven services, such as AI. In these markets, scalability and flexibility prove to be more important than physical presence.
Sectors under structural pressure
A different picture emerges at the lower end of the spectrum, with health and welfare services (sector R) experiencing the sharpest change. While this sector still showed strong growth in 2024, the balance in 2025 turns to a sharp decline. With a drop of nearly 10,000 enterprises in the balance year-on-year, this is the largest negative shift in all sectors. This points to structural pressures from personnel shortages, regulatory pressures and rising costs, among other things.
Business services also shows vulnerability. Rental of movable property and other business services (sector O) shows a sharp correction. The sector falls sharply from the previous year, suggesting declining investment readiness and greater caution in business spending.
Table 6: Top 5 sectors with largest decline in net growth (2024 vs. 2025)
| SBI | Sector | Net growth 2024 | Net growth 2025 | Change |
| R | Health and welfare care | 5.437 | -4.280 | -9.717 |
| O | Rental of movable property and other business services | 6.696 | 1.717 | -4.979 |
| F | Construction | 843 | -2.521 | -3.364 |
| H | Transportation and storage | 2.419 | 818 | -1.601 |
| A | Agriculture, forestry and fishing | 920 | -231 | -1.151 |
The construction industry (sector F) also remains vulnerable. Despite a high number of startups, the number of closures exceeds the inflow. This results in negative net growth and confirms the image of a sector with high dynamics but limited stability.
Table 2: Top 5 sectors with the least growth (2025)
| SBI code | Sector | Started | Terminated | Net growth |
| R | Health and welfare care | 16.892 | 21.172 | -4.280 |
| F | Construction | 21.468 | 23.989 | -2.521 |
| A | Agriculture, forestry and fishing | 2.584 | 2.815 | -231 |
| E | Extraction and distribution of water; waste and wastewater management and remediation | 132 | 189 | -57 |
| B | Mining and quarrying | 33 | 70 | -37 |
Long-term trends (2021–2025)
When examining trends over recent years, it becomes apparent that incidental explanations are giving way to structural patterns.
1. Structural strengthening: Real estate trading and operations (sector M) stands out as one of the few sectors with a structurally rising trend in recent years. Although the absolute net growth is not the highest, the balance improves year after year as the number of startups increases and closures remain stable. The sector is adapting through restructuring and specialization, ensuring steady strengthening.
Table 7: Top 5 sectors with fastest net growth (2021 – 2025)
| SBI | Sector | Trend net growth (weighted) |
| M | Operation of real estate trading | +455,5 |
| J | Publishing, media and broadcasting activities | +115,0 |
| U | Households as employers; undifferentiated household activities | +0,8 |
| V | Extraterritorial organizations and agencies | -0,9 |
| P | Public administration, public services and compulsory social insurance | -1,2 |
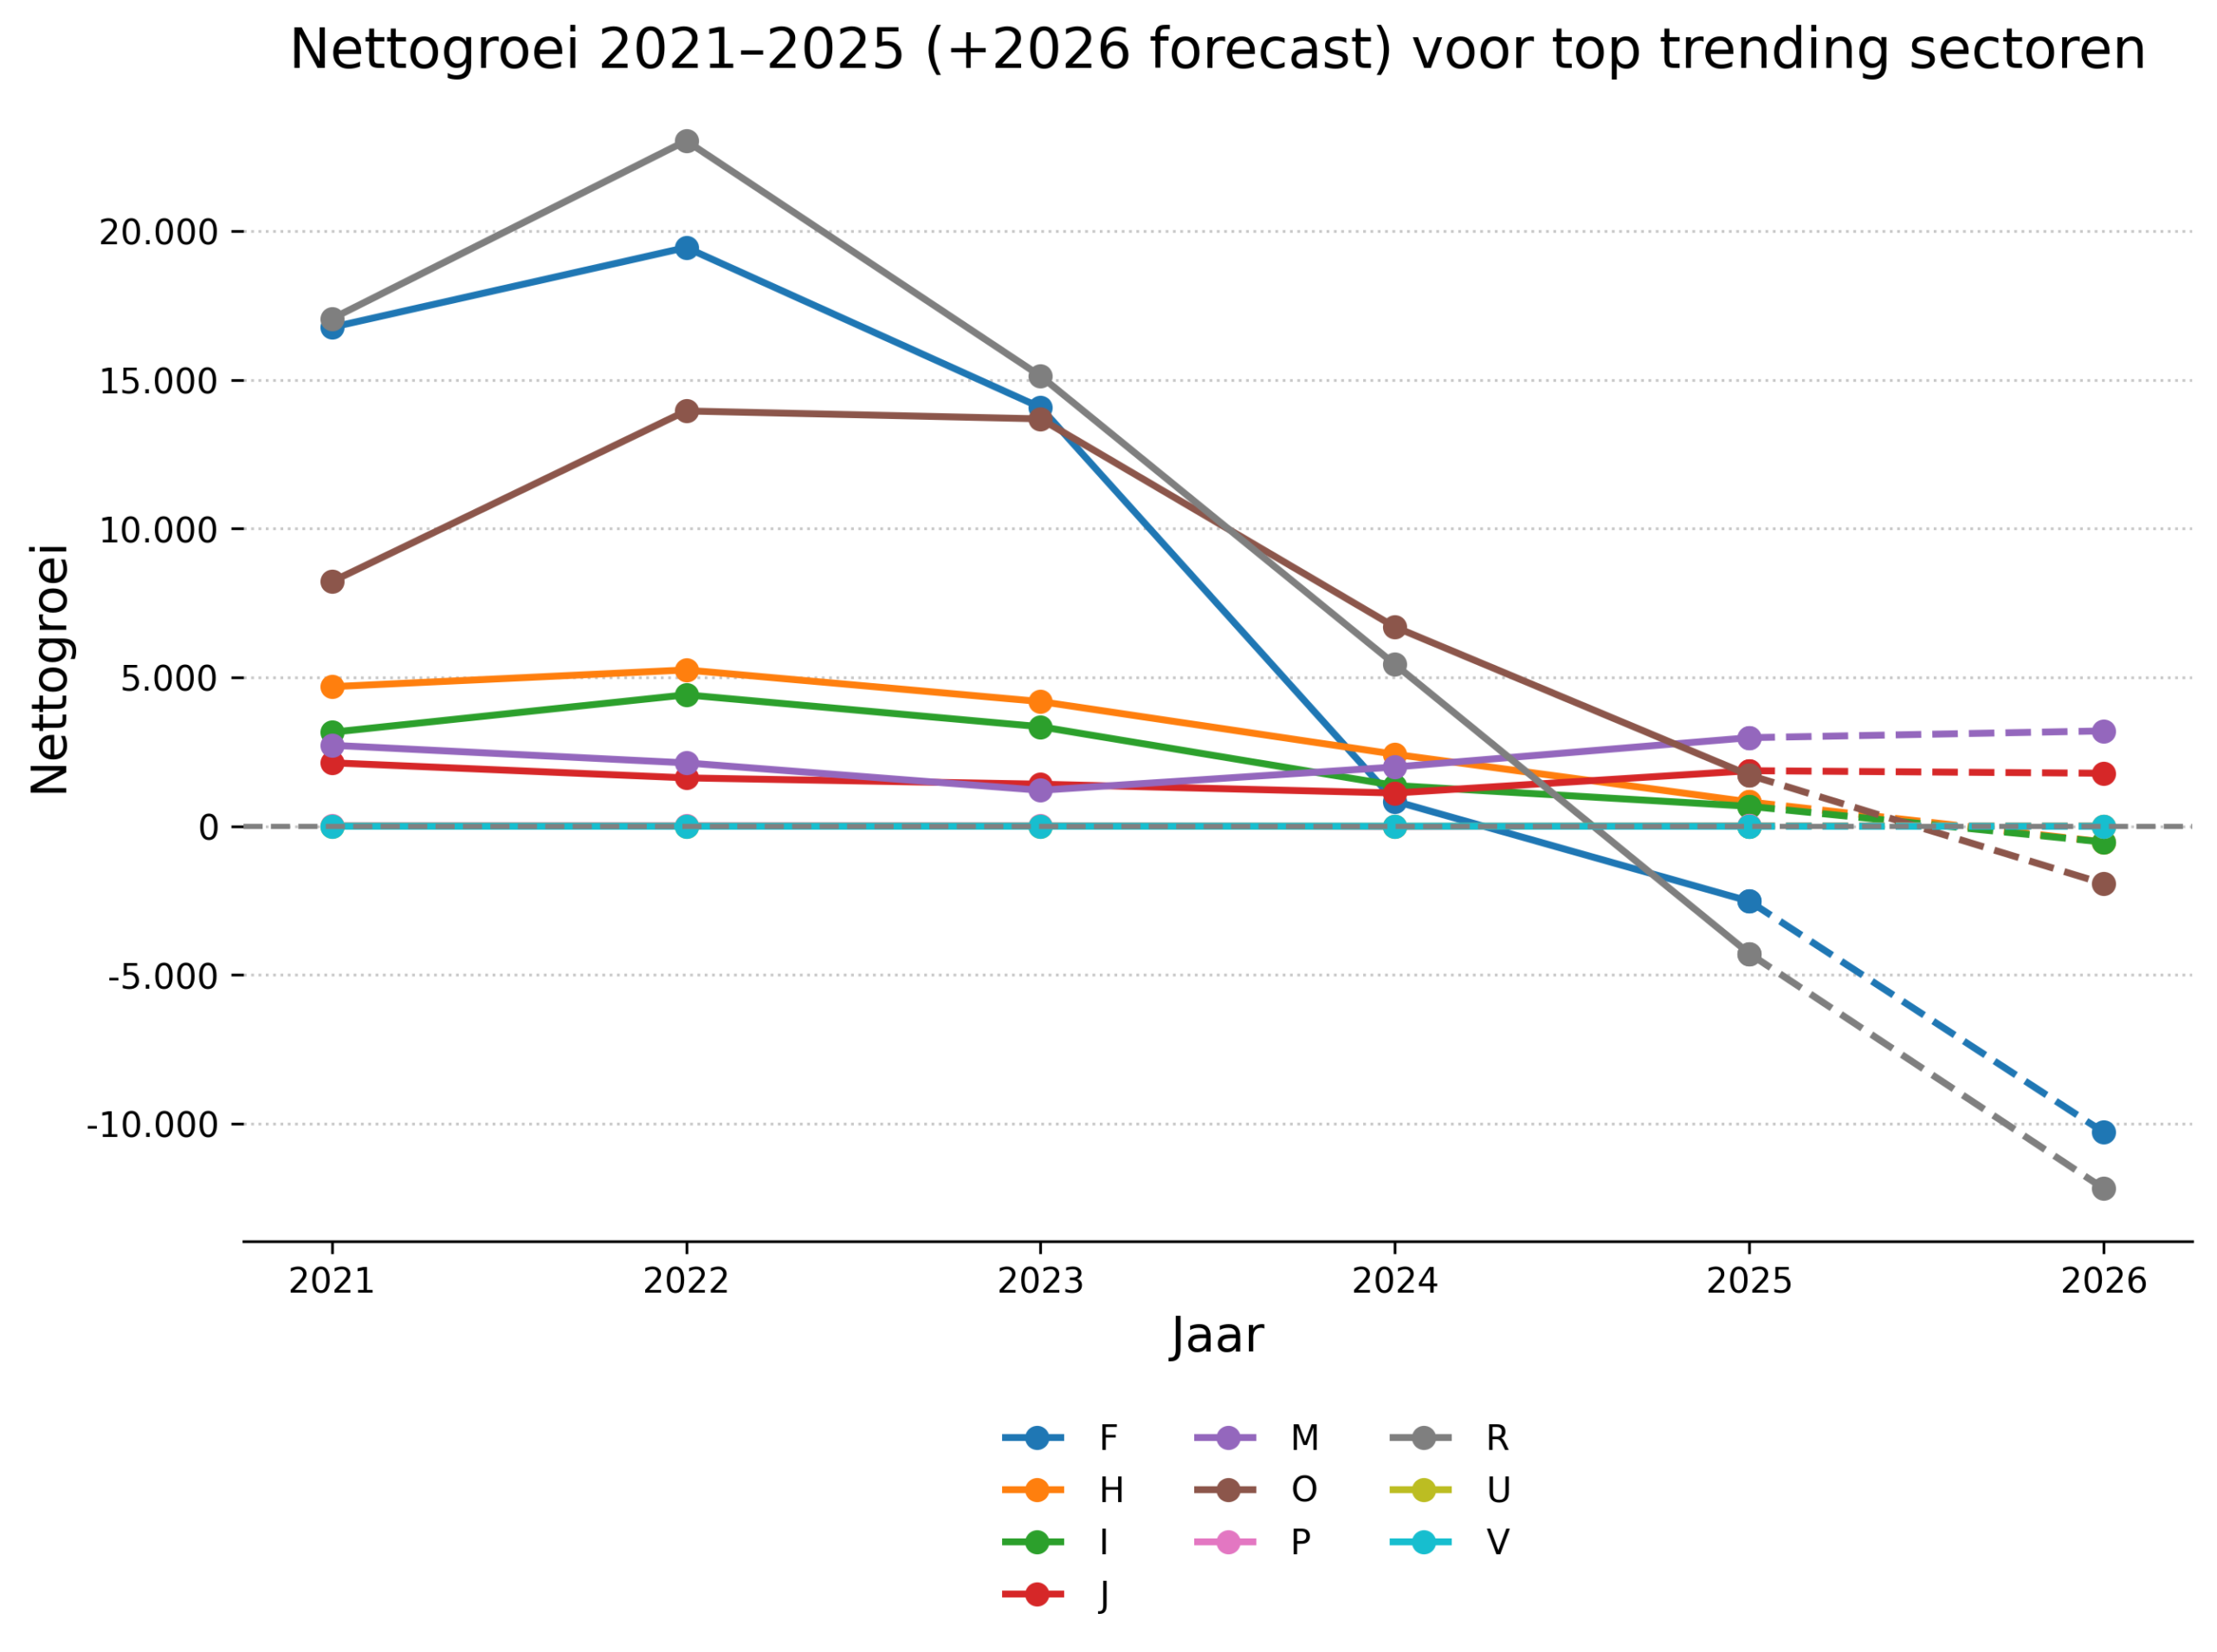
2. Structural erosion: Unlike real estate, the healthcare sector (R) shows gradual erosion. After peaking in 2021 and 2022, growth leveled off, to turn negative in 2025 due to a combination of fewer start-ups and more quitters. Construction (F) also suffers from a continued weakening of the business environment, with outflows peaking in 2023 and 2024.
For the transportation and storage (H) and hospitality (I) sectors, the picture is less extreme, but the trend since 2022 has been unmistakably downward. These sectors are expected to record negative growth for the first time in 2026.
Table 8: Top 5 sectors with the largest decline in net growth (2021 – 2025)
| SBI | Sector | Trend net growth (weighted) |
| R | Health and welfare | -8.524,8 |
| F | Construction | -7.023,6 |
| O | Rental of movable property and other business services | -4.223,6 |
| H | Transportation and storage | -1.443,4 |
| I | Accommodation, food and beverage services | -1.132,4 |